Could WiFi frames detect human presence?

Table of Contents
Imagine being able to tell how crowded a public space is without relying on privacy-invasive cameras or needing people to use card systems. Sounds like a neat trick, doesn’t it? Well, a recent experiment explored exactly that, leveraging the ubiquitous WiFi signals from our everyday devices to estimate occupancy levels.
The Big Idea: Counting with WiFi!⌗
We all carry smartphones and other connected gadgets that are constantly searching for wireless networks and emitting radio waves. This experiment, conducted as part of a Computer Engineering degree, harnessed this constant communication to detect human presence in various environments, from controlled settings to public spaces like the University of Madeira. The core principle is simple: by analysing the frequency of specific WiFi signals, called IEEE 802.11 management frames, patterns of human presence can be discerned over time.
Why is this a game-changer?
- Privacy-Friendly: Unlike cameras or access control systems, this method doesn’t require identifying individual devices or storing personal data, making it far less intrusive. The models can work without logging or storing personal “fingerprints”.
- Cost-Effective: It uses existing WiFi infrastructure, making it a much cheaper solution compared to traditional methods that need extensive hardware installations.
- Useful Insights: It can help understand live occupancy, study footfall over days, and even let people know if a space is crowded before they arrive.
How the Experiment Worked⌗
The system’s architecture provides a clear picture of how all components work together to capture and process WiFi data:
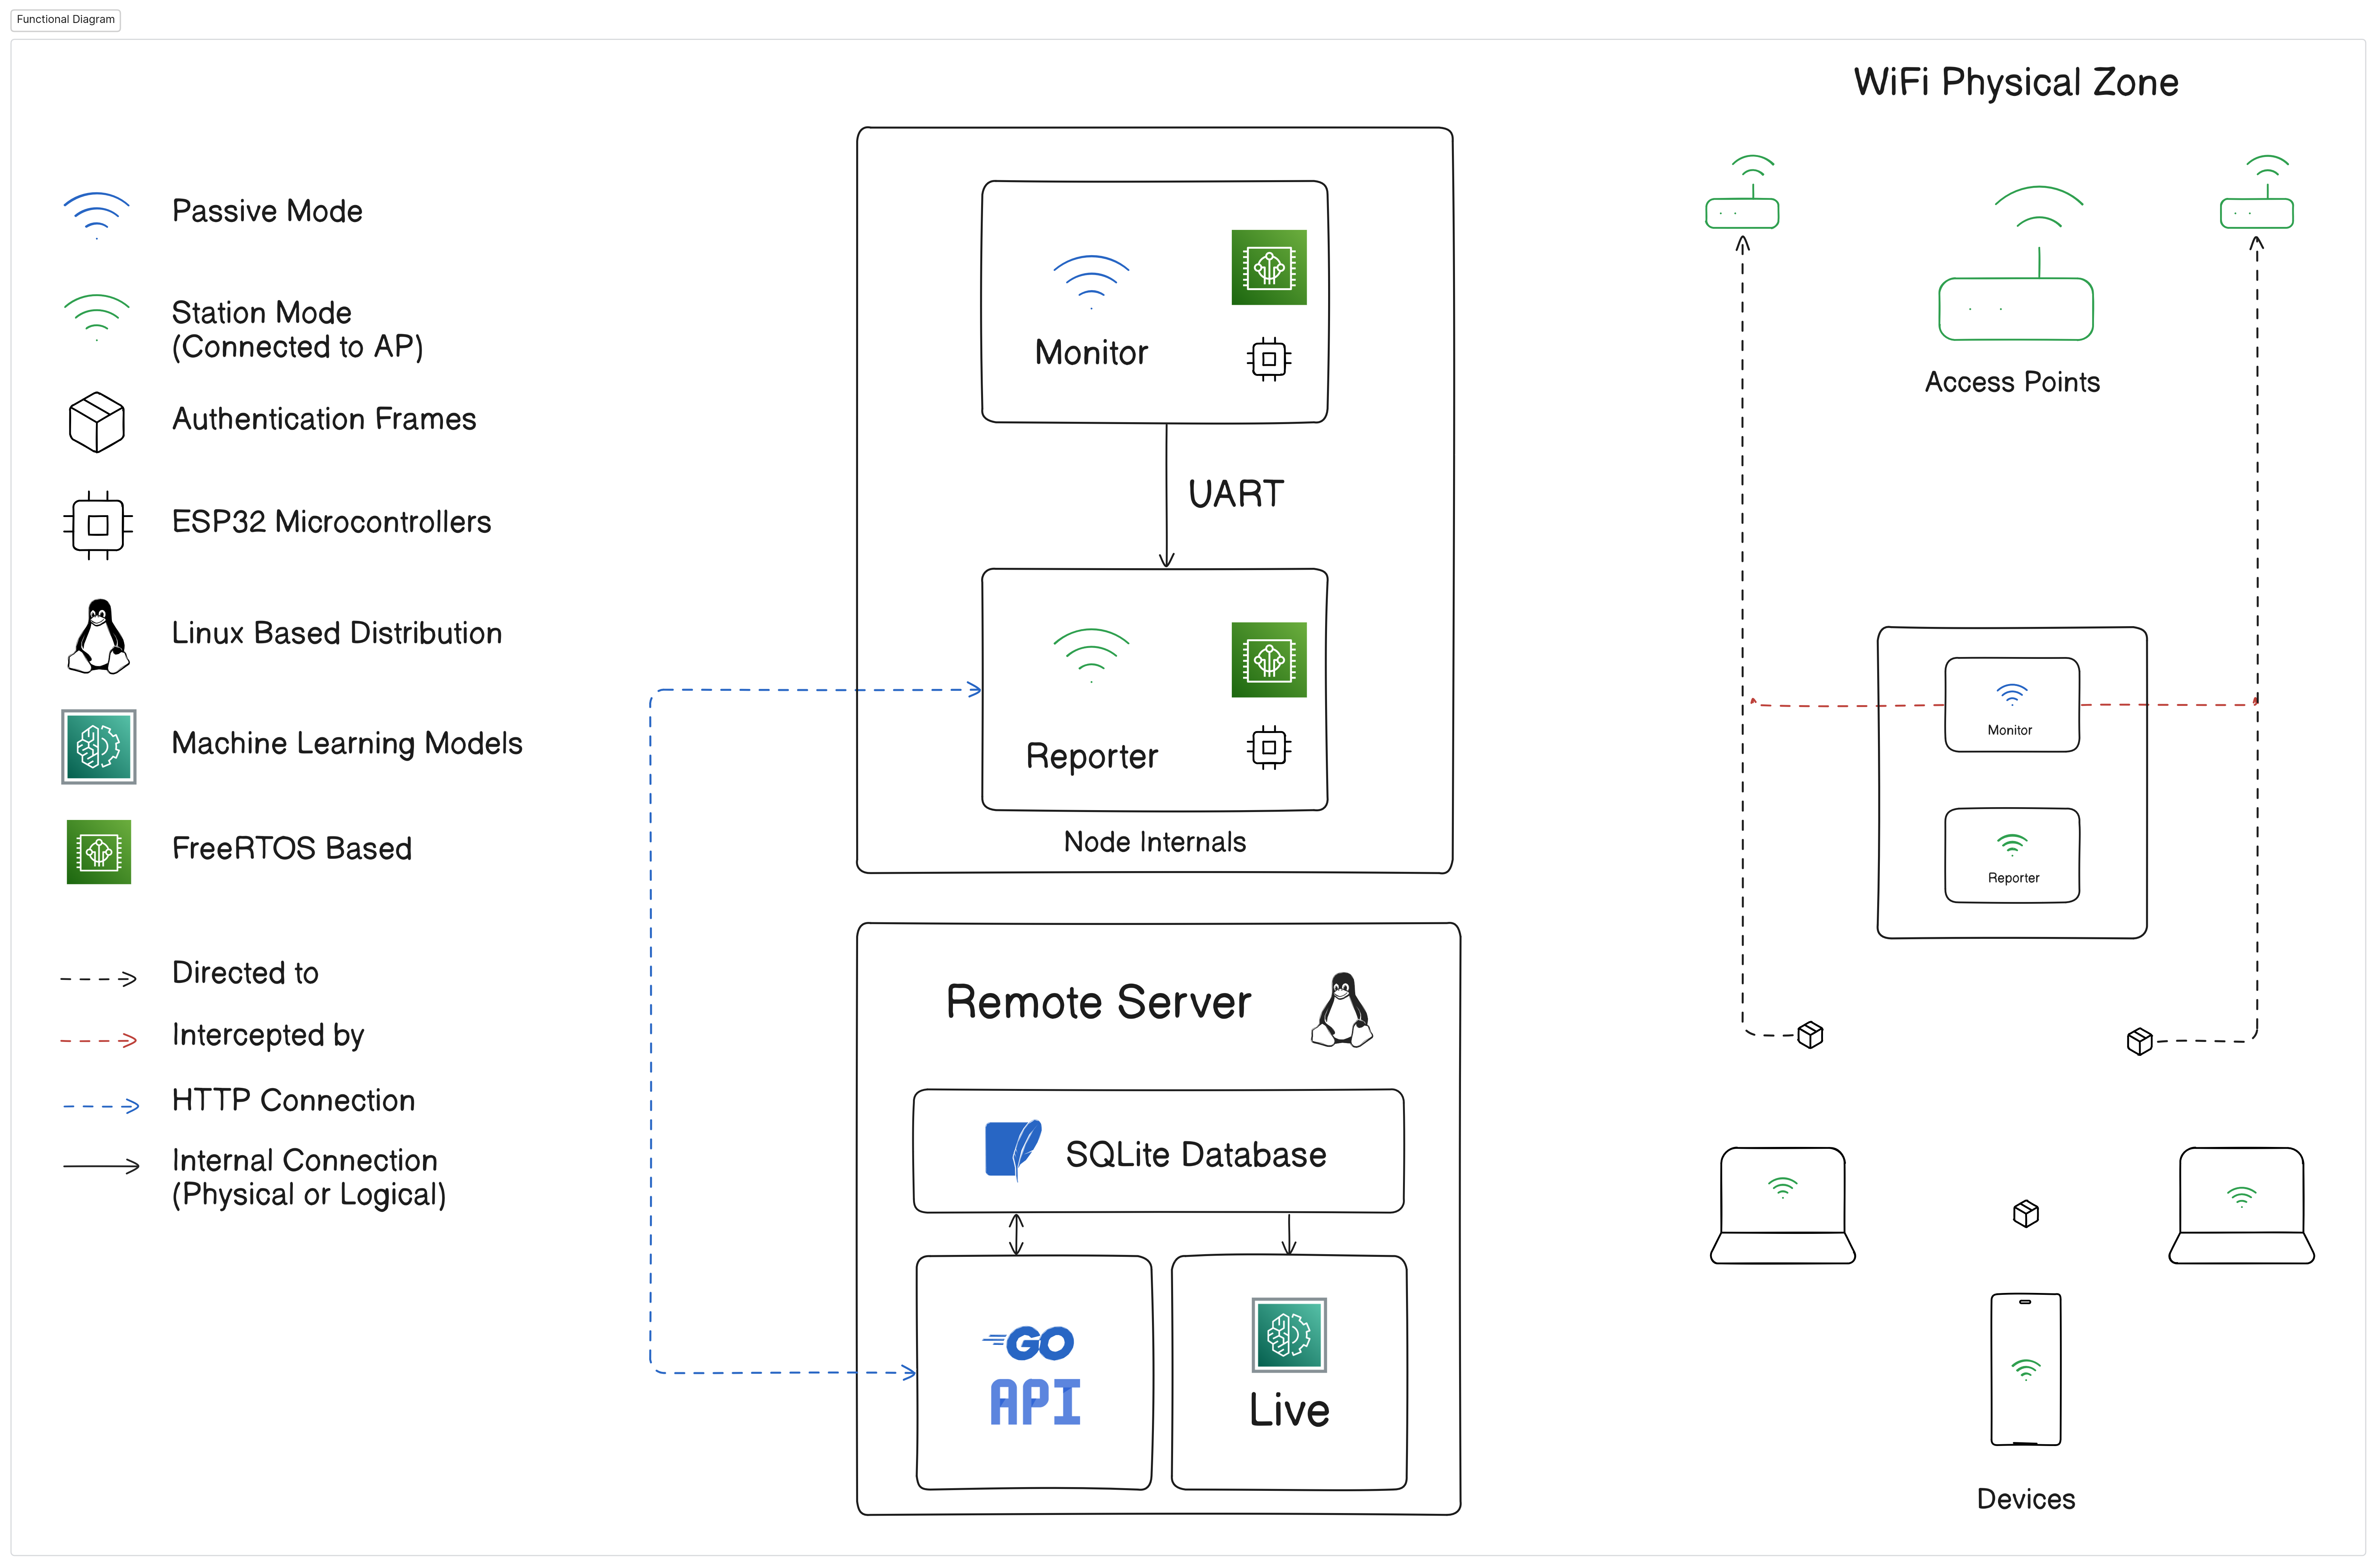 Complete system architecture showing the flow from WiFi frame capture to occupancy estimation
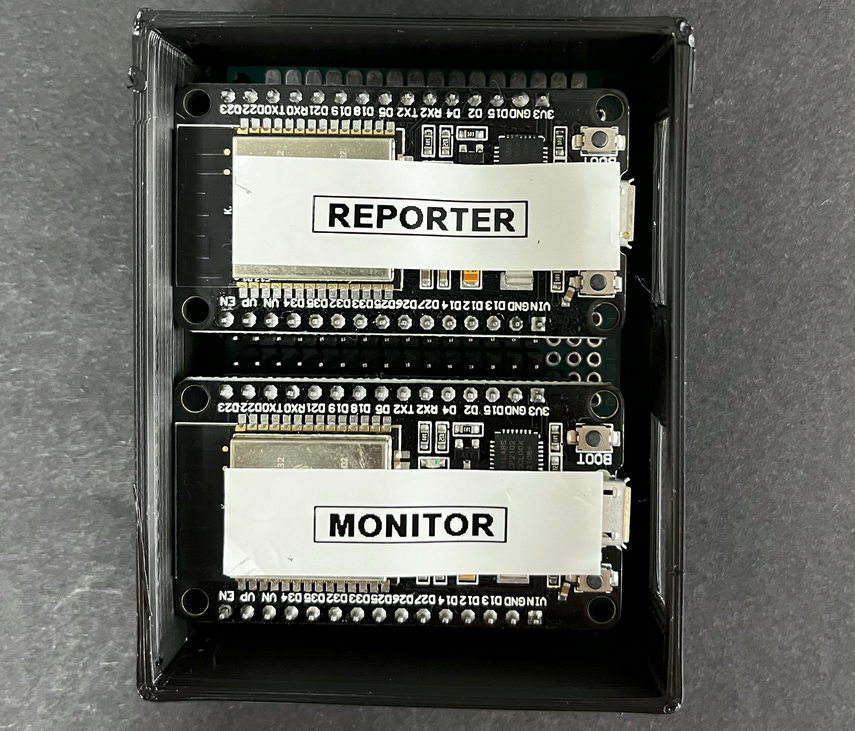
The heart of this experiment was a custom-built device designed to intercept IEEE 802.11 WiFi traffic. This device, called a “node”, comprised two tiny computers called ESP32 microcontrollers.
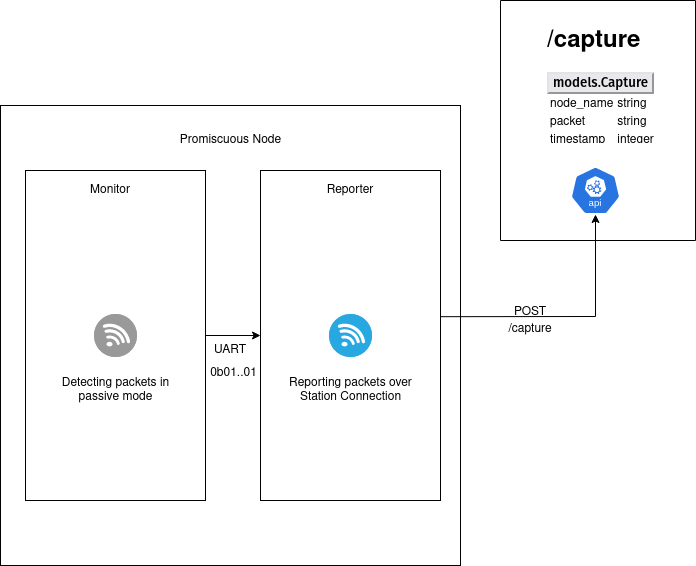 Dual ESP32 node design: one for monitoring WiFi frames, another for data transmission
- One ESP32 acted as the “monitor”, operating in promiscuous mode - think of it as “eavesdropping” on all WiFi chatter in the area, capturing frames even when they’re not meant for our device.
- The second ESP32, the “reporter”, took the captured data and forwarded it to a central server via UART serial communication. This two-device setup prevented data loss and kept things running smoothly.
The data flow through the system follows a structured path from capture to storage:
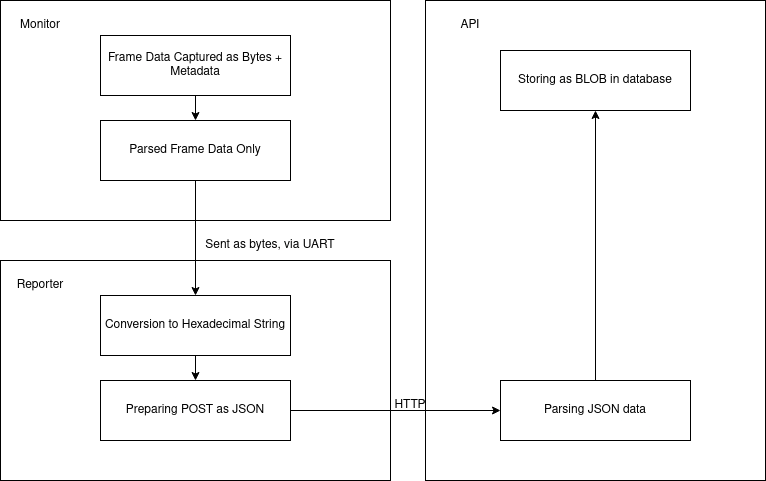 Data pipeline from raw WiFi frames to structured database storage via JSON API
The captured frame data gets converted from its raw binary form into clean bytes, sent from monitor to reporter via UART. The reporter then transforms these bytes into a hexadecimal string and packages it as JSON before sending it to an API running on a Linux server, which stores everything in a SQLite3 database.
Making Sense of the Data: Machine Learning⌗
Once the data was collected, the real magic happened! The experiment used machine learning-based regression models to analyse the WiFi frame frequency and estimate occupancy. Think of these models as smart algorithms that learn patterns from the collected data (WiFi frames) and correlate them with the actual number of people in a space.
The researchers tested several machine learning approaches:
- Linear/Polynomial Regression: Simple models that find straight or curved line relationships.
- Multi-Layer Perceptrons (MLP): Neural networks that can capture complex, non-linear patterns in the data.
- Random Forest: Combines many decision trees, each trained on different data subsets for more robust predictions.
- Gradient Boosting: Builds models sequentially, where each new model fixes the mistakes of previous ones.
- Ada Boosting: Similar concept, but focuses more on the data points that previous models got wrong.
- Support Vector Machines (SVM) and K-Nearest Neighbors (KNN).
The winner? Gradient Boosting turned out to be the star performer, consistently delivering the most accurate occupancy estimates across different environments.
But how does this all work mathematically? If we consider $F(t)$ as the cumulative WiFi frame count at time $t$, then the system measures the frame rate $r(t) = \frac{dF}{dt}$. Any predictive model can then map this rate to occupancy estimates:
$$\hat{N}(t) = f(r(t), r(t-1), \ldots, r(t-k)) + \epsilon$$
Where $\hat{N}(t)$ is the estimated number of people, $f$ is the predictive function we’re trying to learn, and $\epsilon$ represents prediction uncertainty. This captures how the instantaneous rate of WiFi frame detection translates into human presence estimates.
Here’s how polynomial regression performed with a degree of 3, showing improved fitting compared to simple linear regression:
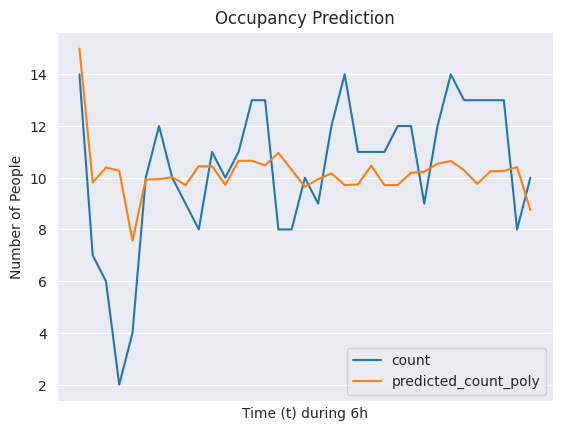 Polynomial regression (degree 3) fitting WiFi frame rates to occupancy data
The Random Forest model demonstrated strong performance with its ensemble approach:
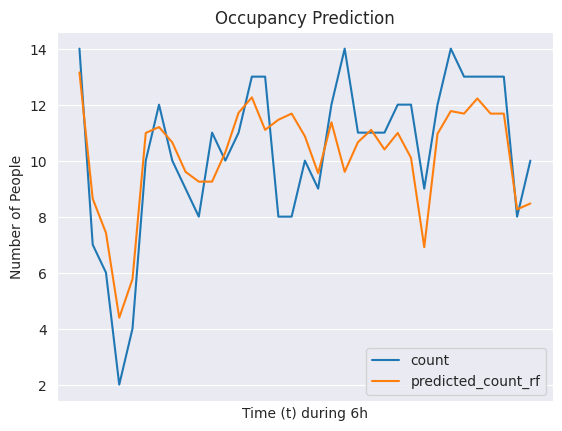 Random Forest model predictions showing ensemble learning effectiveness
Gradient Boosting proved to be particularly effective, delivering the best results:
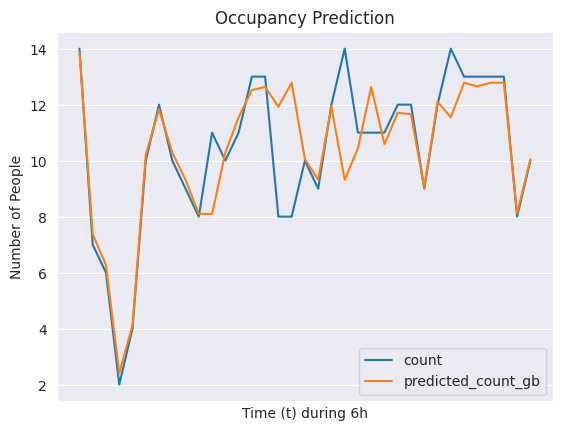 Gradient Boosting achieving the highest accuracy in occupancy estimation
Since Gradient Boosting performed best, we can now specify our predictive function more precisely. The Gradient Boosting model works as:
$$f_{GB}(r) = \sum_{m=1}^{M} \gamma_m h_m(r)$$
Where $h_m$ are weak learners (decision trees), $\gamma_m$ are their weights, and $M$ is the number of boosting iterations. Each tree learns to correct the residual errors of the previous ensemble, making it particularly effective at capturing the complex relationship between WiFi frame rates and human occupancy.
Key Insights from the Case Studies⌗
The experiment revealed some fascinating insights through real-world testing:
-
Not All Frames Are Equal: Raw WiFi data was actually negatively correlated with occupancy! But here’s the kicker - by filtering for specific frame types (mainly authentication and association frames while ignoring periodic beacon frames), the correlation flipped positive and became much stronger.
-
Less Can Be More: Counterintuitively, monitoring just one busy WiFi channel worked better than rapidly switching between multiple channels. Sometimes focused listening beats trying to hear everything at once!
-
Long-Term Patterns Emerge: A month-long deployment in a research lab revealed beautiful circadian rhythms in the WiFi traffic. Frame counts peaked during work hours and dropped at nights and weekends - exactly what you’d expect from human activity patterns.
The time series analysis revealed compelling patterns in the data, showing distinct seasonal components that aligned perfectly with human activity patterns:
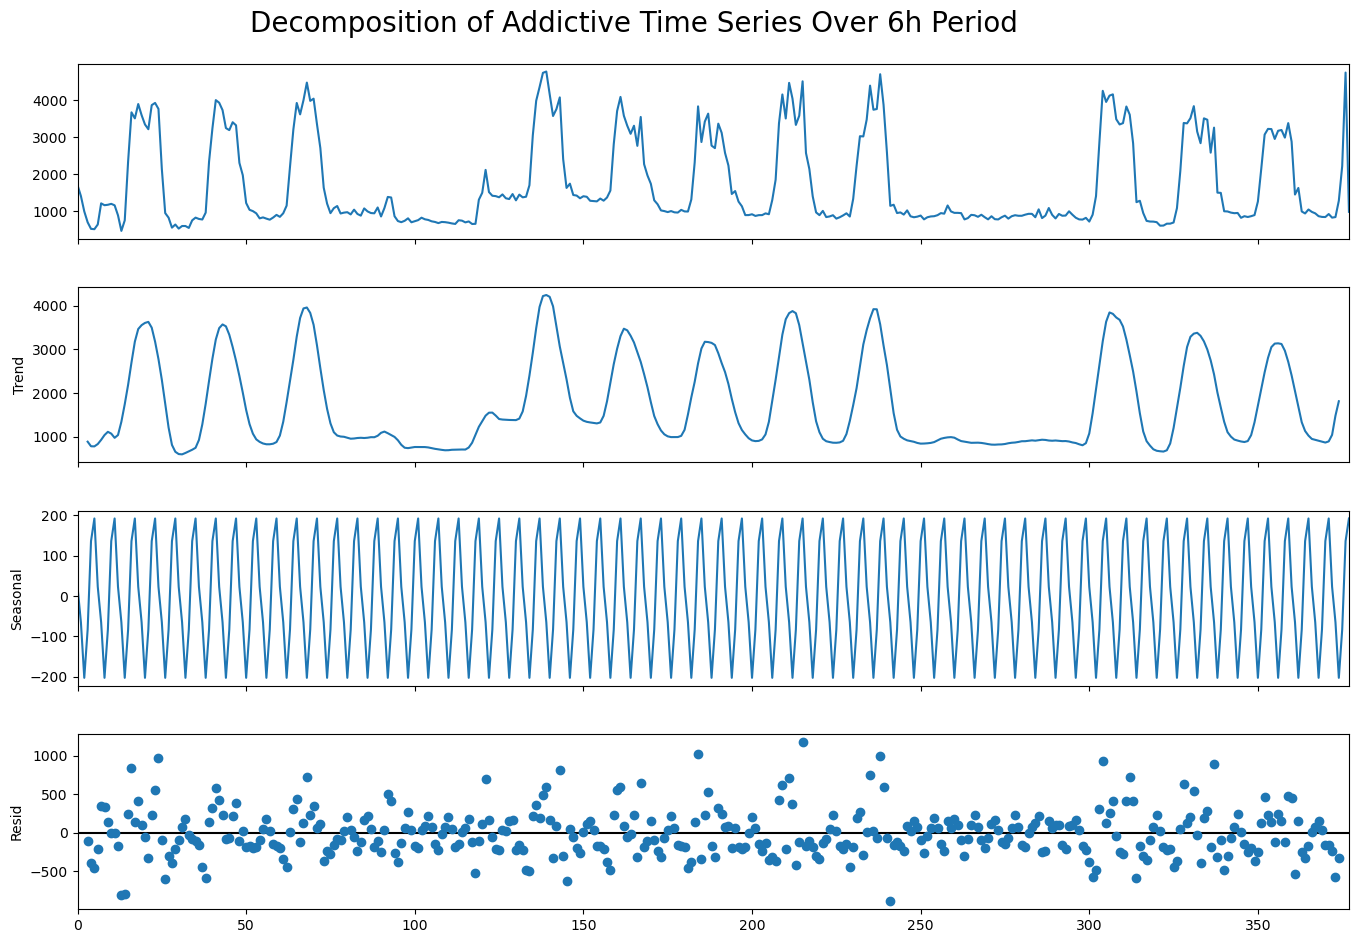 Time series decomposition revealing patterns in WiFi frame activity over two weeks (in the image)
What’s Next?⌗
The system works great, but there’s always room for improvement! Right now, the models excel at predicting occupancy within their training range (2-14 people) but struggle when extrapolating beyond that.
Future directions include:
- Scaling up data collection across more diverse environments and longer time periods
- Hybrid model approaches that combine multiple algorithms for even better accuracy
- Ultra-low power designs using sleep modes and edge processing
- Remote deployment studies in areas with sparse WiFi infrastructure
The Mathematical Beauty: It’s All About the Rate⌗
Here’s where things get really interesting from a mathematical perspective. What this system is essentially measuring is the rate of change in WiFi frame activity - or in calculus terms, the derivative of frame frequency over time.
When humans enter a space, their devices immediately start emitting authentication frames, probe requests, and other management frames. This creates a measurable spike in the rate at which frames are detected. Conversely, when people leave, this rate decreases.
The beauty of this approach is that it captures not just static presence, but the dynamic nature of human activity. When someone walks into a room, their device doesn’t just emit one frame - it creates a continuous stream of communication attempts, each contributing to the rate we’re measuring.
This experiment truly showcases the potential of using readily available technology to solve real-world problems in a smart and privacy-conscious way. By leveraging the mathematical relationship between WiFi frame rates and human presence, we can create systems that are both effective and respectful of privacy - a pretty elegant solution to a complex problem!
The Actual Hardware⌗
For those curious about what the real prototype looked like (beyond the AI-enhanced cover image), here’s the actual hardware that made this research possible:
 The first working prototype - raw and functional
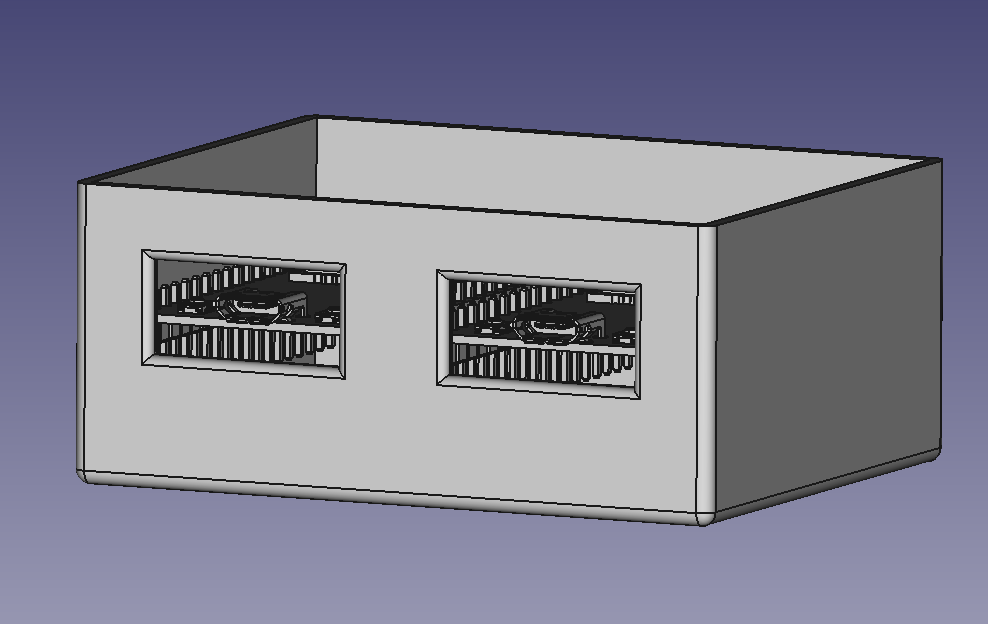 3D model of the final design in FreeCAD
Sometimes the best innovations come from hands-on engineering - custom PCB design, precise 3D modeling, and the satisfaction of making hardware and software work together seamlessly!